- Before you need to learn how to create a flow chart, first you should know what a flow chart is.
What is Flow Chart?
Flow chart is graphical representation of an algorithm.
A well-designed flowchart should be easy to read and follow a logical sequence of steps.
Advantages:
It is easy to understand.
It is a better way of communicating the logic of the system.
It provides better documentation.
Disadvantages:
It is difficult to draw flowcharts for large and complex system.
If changes are done in software, then the flowchart must be redrawn.
Rules for Creating Flow Chart:
Flowchart opening statement must be ‘start’ keyword.
Flowchart ending statement must be ‘end’ keyword.
All symbols in the flowchart must be connected with an arrow line.
The decision symbol in the flowchart is associated with the arrow line.
Flowchart Symbols
Terminal :
The oval symbol indicates Start, Stop and Halt in
a program’s logic flow.
Input/Output :
A parallelogram denotes any function of
input/output type.
Processing :
A box represents processing. All arithmetic
processes such as adding, subtracting, multiplication and
division are indicated by process symbol.
Decision :
Diamond symbol represents a decision point. Decision based operations such as yes/no question or true/false are indicated by diamond in flowchart.
Flow lines :
Arrows represent the direction of flow of control and relationship among different symbols of flowchart.
Connectors :
Whenever flowchart becomes complex or it spreads over more than one page, it is useful to use connectors to avoid any confusions. It is represented by a circle.
Predefined Functions/Process :
is represented as a box with double lines on its sides.
How to Make Flow Chart?
You can make a flow chart using draw.io. You can type draw.io on Google; either you can download it, then use it, or without downloading, you can use it online to make a flow chart.
draw.io is free online diagram software for making flowcharts, process diagrams, org charts, UML, ER and network diagrams.
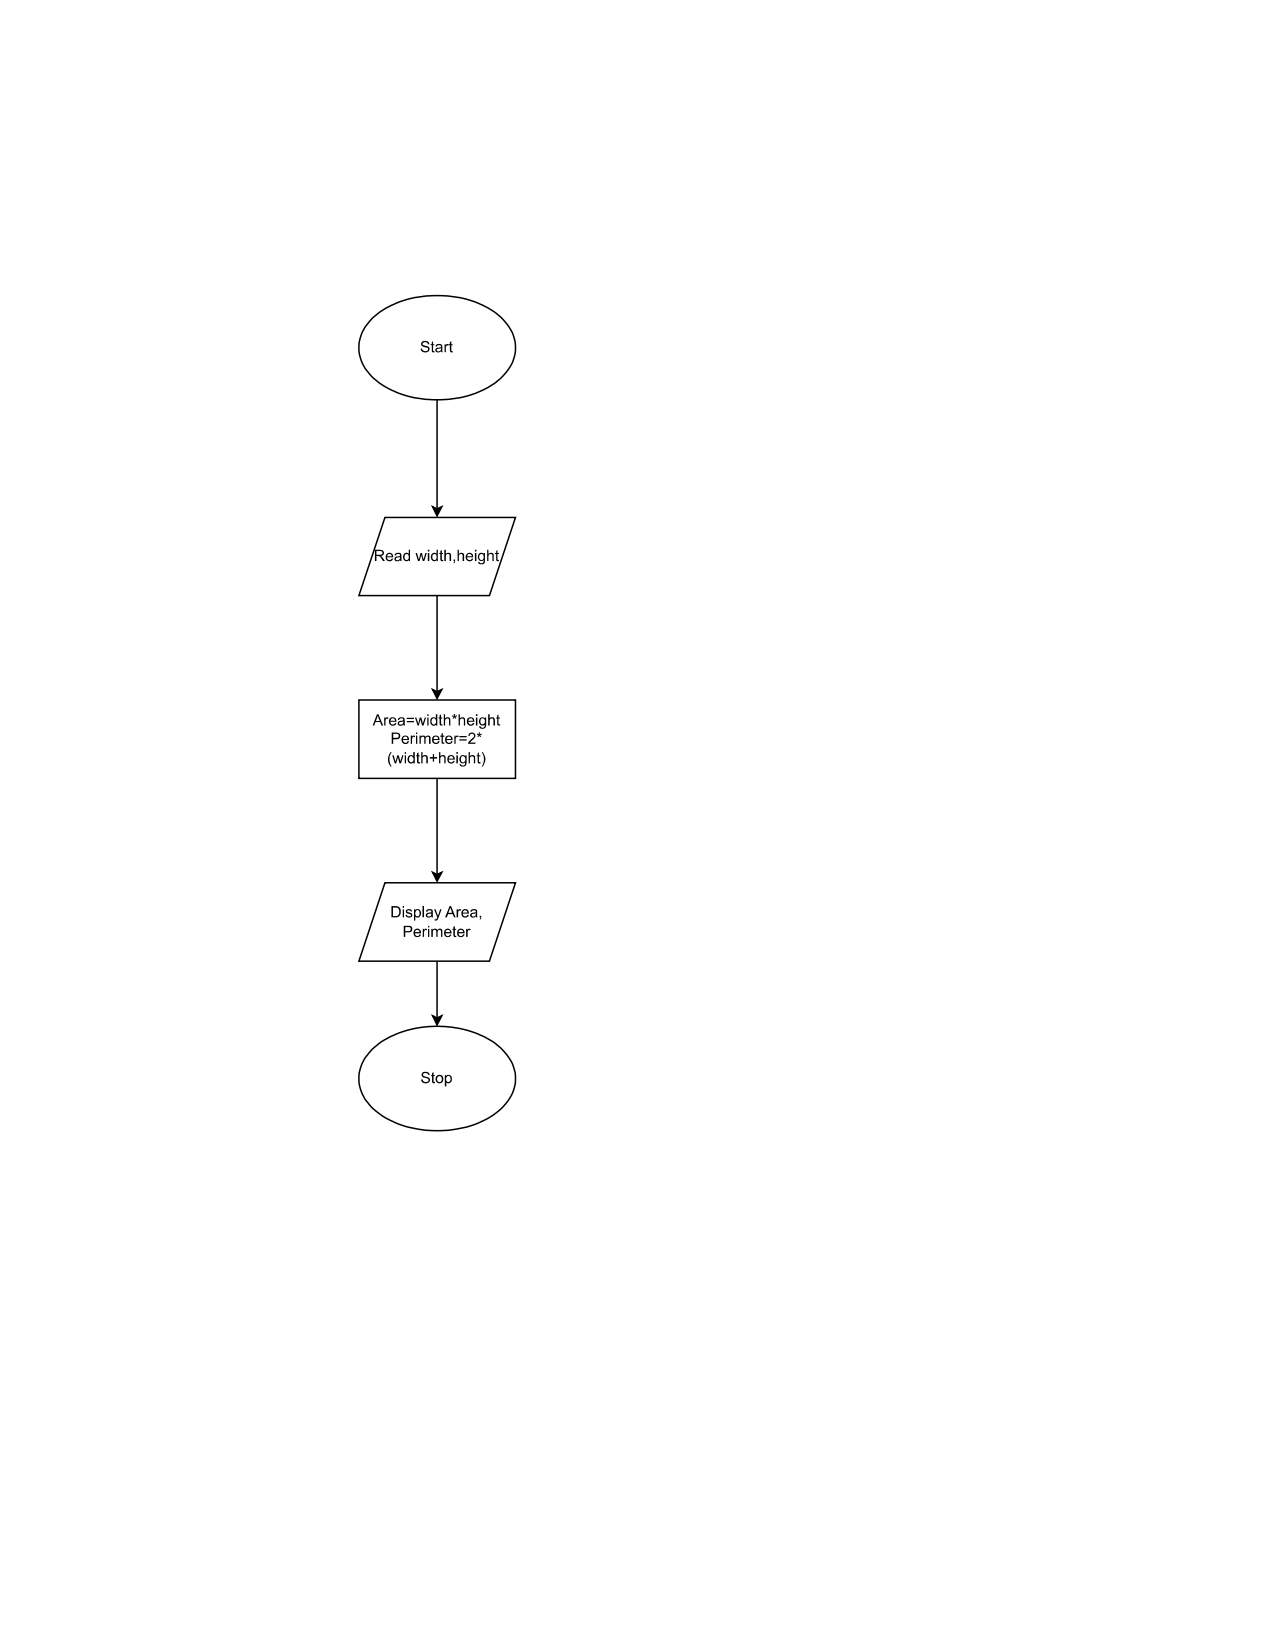
Flowchart Example: